
Time Series
Unsupervised Learning
Completed
Power Patterns: Harnessing Electricity for Innovation
$15,000
Completed 112 weeks ago
170 teams
Background
Have you ever wondered when it is least expensive to run your air conditioner in the summer and still stay cool? How about why you often see office buildings with lights left on at night? Electricity is consumed as it is generated, and certain times of day there is more consumption, while at others there is less. Every building has a unique signature in electricity consumption patterns that depends on a variety of factors. A load profile is a data record of a utility customer's electricity consumption patterns over a specific period of time. It ranges from minutes to years and provides valuable insights into when and how energy is being used, allowing electric utility companies to better understand behaviors and preferences. Load profiles record energy usage throughout the day, showing peaks and valleys in energy consumption levels. By analyzing load profiles, electric utilities can identify trends, patterns, and anomalies in energy usage which helps them to make decisions about rate structures, grid management, and demand response strategies. Critically, load profiles can help electric utilities to design and implement time of use tariffs and other demand response programs to optimize energy efficiency, reduce peak demand, and increase the reliability of the electric grid.
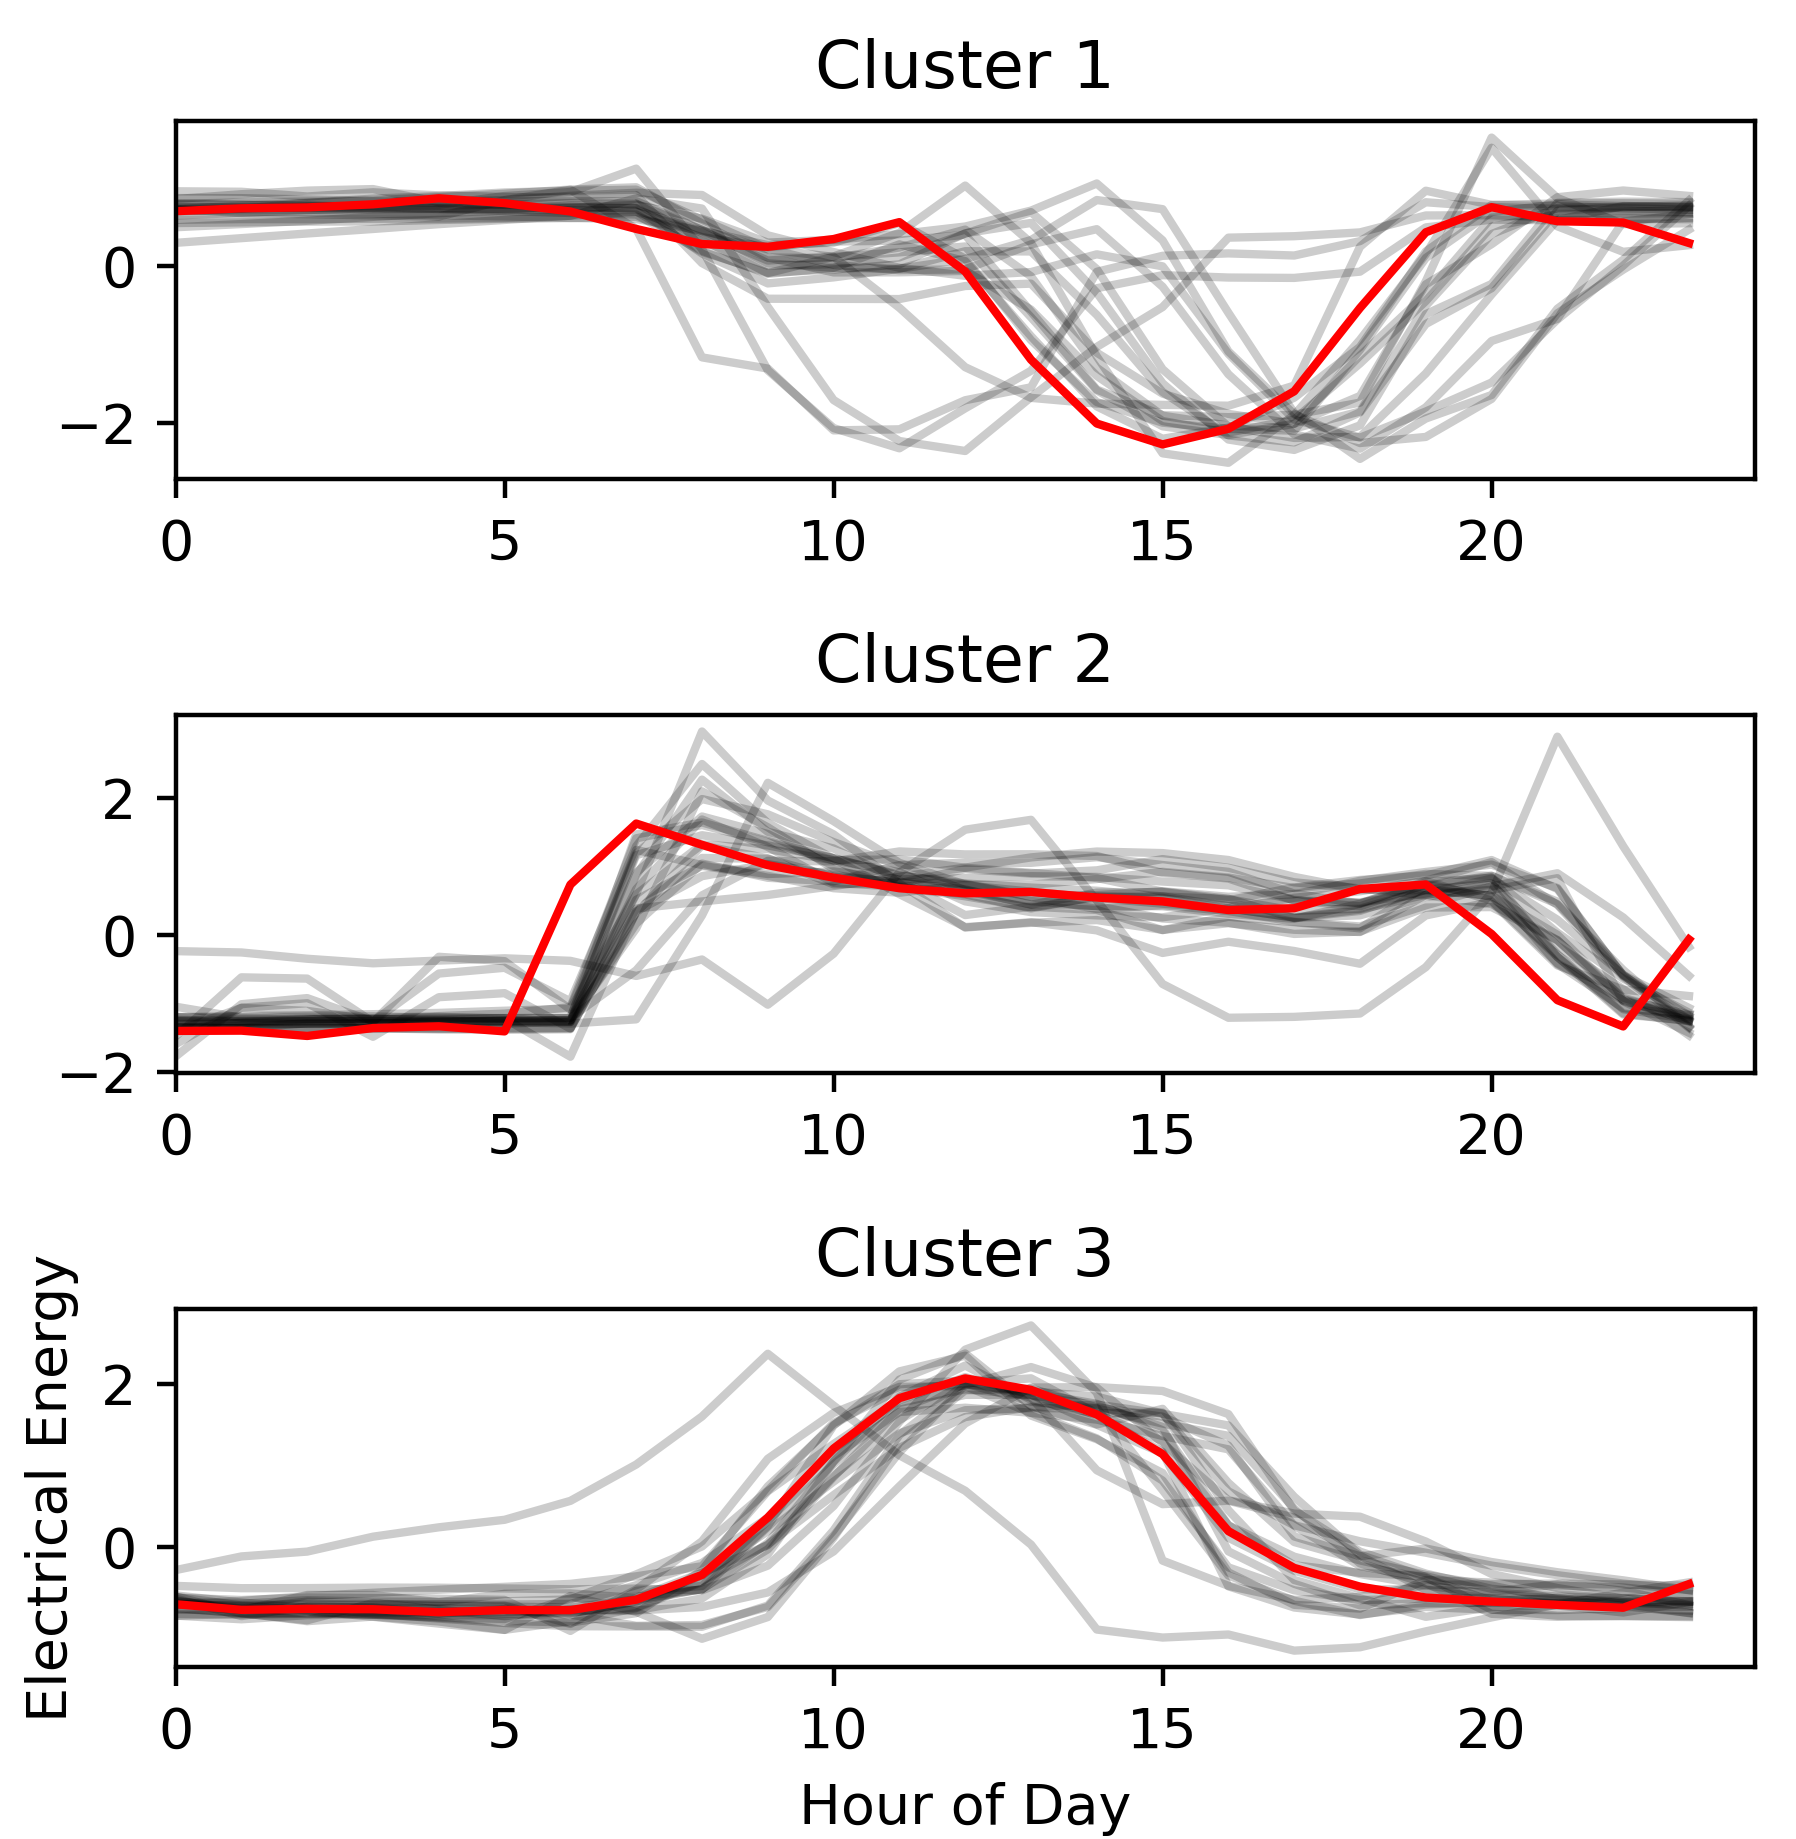
Identifying key customer segments with similar load profiles (Figure 1.) allows utilities to target specific groups to participate in demand response initiatives. For example, customers with high energy usage during peak hours could be charged a higher rate to encourage a reduction in consumption during times of high demand. This in turn could alleviate strain and congestion on the grid, and avoid expensive peak energy costs.
Evaluation
Can you build a model to accurately cluster load profiles for a variety of buildings? What about designing a demand response program for a variety of customer segments? This is an unstructured competition where your task is to create a Jupyter Notebook that best addresses the Evaluation criteria below. Submissions will be judged by Onward based on how well they address:
Unsupervised Learning (25%)
Is the algorithm selection process well documented in the notebook? Does the selected clustering algorithm suit the data and align with the chosen demand-response (DR) program(s)?
Are evaluation criteria for the chosen clustering algorithm(s) well explained?
Does the notebook contain a clear interpretation of the algorithms results, and does it explore the stability and generalizability of the solution?
Note: We strongly recommend keeping the number of clusters under 10, as designing DR programs for a very large number of building clusters (customer segments) is often not very practical. With that said, if a slightly larger number of clusters strongly suits your chosen DR program, you may go as high as 15, but certainly no more than that. Exceeding 10 clusters must be thoroughly justified, and 15 is a strict upper limit.
Interpretation (25%)
Does the notebook draw meaningful conclusions from the analysis and provide insights and recommendations based on the findings?
Are results clearly explained and connected to the challenge goal?
Are the demand response program recommendations clearly explained?
Exploratory Data Analysis (20%)
How well does the notebook explain the data pipeline including data loading, cleaning, transformations, and analysis?
Are appropriate visualizations used to explore and explain the dataset?
Feature Engineering and Extraction (20%)
What features are defined and extracted for training the clustering algorithms? Are both traditional and modern deep learning techniques explored? Are knowledge-based feature engineering explored?
Does the notebook explain the reasons behind feature engineering and extraction strategies?
Does the notebook utilize relevant time series analysis techniques to explain the patterns?
Notebook Presentation (10%)
Is the code well documented, easy to understand and reproduce?
Are all external data sources public and cited correctly?
Final submissions must contain:
Jupyter Notebook: your notebook should clearly outline the steps in your pipeline
Requirements.txt file: This file should include all the packages and modules to run the training, clustering, and all other analysis for your submission. We recommend the pipreqs package to generate this file. Python version should be >=3.9.
Supplemental data or code: Include any additional data, scripts, or code that are necessary to accurately reproduce your results
Model checkpoints: A model checkpoint file from the end of your model training process if applicable
The judges will run the submitted algorithm on AWS SageMaker, and will use up to a g5.12xlarge instance. Model inference must run within 24 hours. If the code cannot run in the allotted time, the challenger will be notified and given 24 hours to make edits. If no edits are made, the submission will be disqualified.
Participants are limited to one (1) submission per day. However, only the most recent submission will be judged at the close of the Challenge.
Timelines and Prizes
Challenge will open on March 25, 2024 and close at 22:00 UTC May 24, 2024.
The main prize pool will have prizes awarded for the first ($3,000), second ($3,000), third ($3,000), fourth ($3,000) and fifth ($3,000) in the final evaluation.