
Computer Vision
Completed
Parallel Perspectives: Restoring an Image from 1D Data
$20,000
Completed 122 weeks ago
143 teams
This is part 2 of the 4 part Encoded Reality Series of challenges that take different approaches to analyzing and building models for geophysical data. In the Every Layer, Everywhere, All at Once: Segmenting Subsurface challenge, we introduced you to seismic data; rich in information and ripe for data science advancements.
For this challenge, we’ve provided you with a series of 2D seismic lines that have been scrambled in 1D vertical columns (Figure 1). Your job will be to build a machine learning or deep learning model that can unscramble these traces and restore the original line. This challenge and others in the Encoded Reality Series follow the same theme of breaking down geophysical data into new spaces.
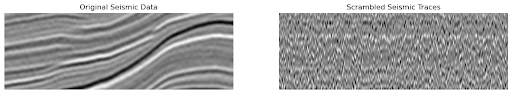
Figure 1. Comparison of original original data on the left and scrambled data on the right.
Background
At first glance, a seismic line might look chaotic to the untrained eye, but upon further inspection, many features begin to step out of the data. These features are the products of how the data was collected and the geology that it is measuring.
The acquisition, processing, and interpretation of seismic data is worth a library of textbooks, beyond the scope of this challenge. However, by looking through the data for this challenge, anyone can pick out numerous general trends. Some examples:
There is often a dull area on the top of the line which represents the water column; much of this data comes from offshore locations.
Higher frequency reflections are more common in the upper parts of the line, while lower frequencies are more common in the lower parts of the line.
The black and white layers alternate on the line, these represent changes in density of the rocks being measured just like an image from a medical ultrasound device.
An algorithm understanding these basic rules has a jump start on solving this challenge.
The geology that the seismic data is measuring also follows some standard rules that geoscientists have observed over the centuries:
Sedimentary rock layers are deposited in horizontal layers and are laterally continuous.
Faults offset layers and can be restored by finding matching patterns of rock layers on either side of the fault.
Different sedimentary rocks have different origins (i.e., rivers, beaches), and those origins have a specific signature on seismic data regardless of whether the data is measuring rocks from 500 or 1 Million Years Ago.
Again, if these tried and tested observations on geology can be taught to an algorithm, that algorithm has a good chance of solving the Encoded Reality Challenge Series. There are numerous features in seismic data that can be used in its interpretation, so as you work through this challenge, keep an eye out for them. You are encouraged to reuse ideas and code from other challenges in the Encoding Reality Series.
Evaluation
To evaluate the performance of your solution, you will need to submit a JSON file that contains the order of patches for several lines in the Test Data set. For this challenge, we will compare your result with original by using a similarity metric for each image from the test dataset and a penalty will be applied for local differences within it:
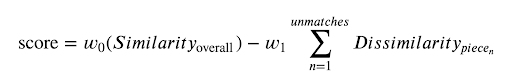
Equation 1
Where w0 = 1 is the weight for overall similarity and w1 = 0.1 is the weight for the penalty (see Equation 1). The base similarity/dissimilarity metric here is NCC (Normalized Cross-Correlation). The aggregation function through all images from the test dataset is the trimmed mean. Please be aware that the higher your score the better your algorithm.
Please note that the json formatting for submissions as you will receive an error if improperly formatted. The Data Tab has a sample submission file for the Test Data set.
For the Final Evaluation, the top submissions on the Predictive Leaderboard will be invited to send Onward Challenges their fully reproducible code to be reviewed by a panel of judges. The judges will run a submitted algorithm on an AWS SageMaker g5.12xlarge instance, and it must run within 24 hours.The global similarity metric used for the Predictive Leaderboard will be used to determine 95% of the user's final score. The remaining 5% of the final score will assess submissions on the interpretability of their submitted Jupyter Notebook. The interpretability criterion focuses on the degree of documentation (i.e., docstrings and markdown), clearly stating variables, and reasonably following standard Python style guidelines.
A successful final submission must contain the following:
Jupyter Notebook with a clearly written pipeline.
Requirements.txt file that instructions on how to run training/inference for the submission
Any supplemental data or code to reproduce your results.
It must contain the libraries and their versions and the Python version (>=3.6). See the Starter Notebook on the Data Tab for an example.
Timelines and Prizes
Challenge will open on December 13, 2023 and close on March 15, 2024 at 22:00 UTC.
The main prize pool will have prizes awarded for the first ($10,000), second ($6,000), and third ($4,000) in the final evaluation.