
Completed
Locate Plot Markers
$0
Completed 180 weeks ago
76 teams
This is the last challenge in this series of challenges to bring old crossplots back to life. In this challenge, we focus on the location of markers (i.e. points, dots, etc.) of old crossplots. This challenge is the most difficult of the series as there are many points to map and the label considers both the axes and the legend. There are a variety of ways this challenge can be solved and we are keen to see what methodology works out the best.
Data and Labels
The data for this challenge are images of crossplots with two axes. The crossplots have a variety of sizes, formats, noise, and orientations. The targets for extraction are the location of markers for each plot. The labels will be a series of tuples enclosed in brackets (see Table 1). Each tuple represents one marker and consists of three numbers: an X coordinate, Y coordinate, and label integer. The label integer will be generated. An example of an image and the corresponding answer are shown below in Figure 1 and Table 1. Note that some images may be missing some information (i.e., may not have a legend).
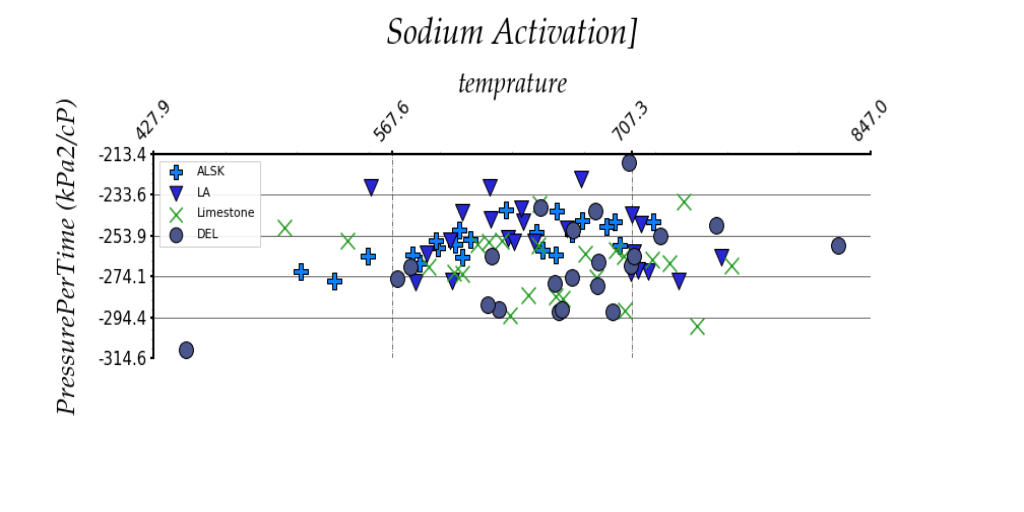
Figure 1: Example crossplot for challenge
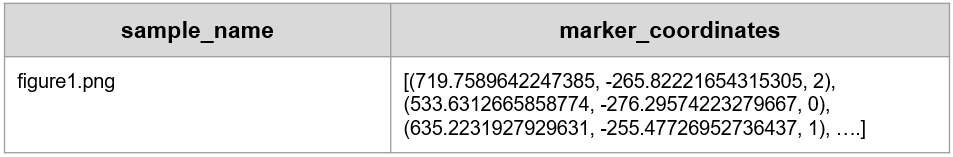
Table 1: Example label for crossplot in Figure 1. Note that each marker has three numbers associated with it: the X axis value, Y axis value, and label integer. Label integers correspond to marker series.
Evaluation
During the challenge, a quantitative score will be used to populate the Predictive Leaderboard. Contestants will submit a CSV as described in the Starter Notebook, containing the target “marker_coordinates” (see Table 1). Submissions will be scored against the test answer key using RMSE. For each graph, the reported coordinates are matched to key coordinates by minimizing euclidean distance. Values are normalized with min/max transformation. The coordinates are scored based on RMSE. Lower scores are considered more successful. Contestants can submit up to 5 CSV predictions per day.
At the end of the challenge, Xeek will request the models from the top 10 submissions for review by a panel of judges. A submission must contain a Jupyter Notebook, a requirements.txt, and any additional parameters a contestant has generated. The requirements.txt should describe the environment used to generate the model. It needs to contain the libraries and their versions, and the Python version (>=3.6 is preferred). See the Starter Notebook on the Data Tab for an example.
The judges will score the top 10 submissions on accuracy and interpretability. The accuracy of the submission counts for 90% of the final score. Accuracy will be determined using the same scoring algorithm described above for the Predictive Leaderboard. The top 20% of scores will receive maximum points (90). Other submissions will receive points based on how close they are to the top-performing submissions based on a min-max normalization.
The interpretability metric counts for 10% of the final score. This qualitative metric focuses on the degree of documentation, clearly stating variables for models and using doc strings and markdown. Submissions with exceptional interpretability will receive maximum points (10). Other submissions will receive points based on the level to which they meet the criteria.