
Computer Vision
Completed
Image Impeccable: Journey to Clarity
$20,000
Completed 90 weeks ago
241 teams
Overview
For this challenge, we’ve provided you with a series of 3D seismic volumes that are in dire need of denoising. Your task, should you choose to accept it, is to build a model that can intake a seismic volume, and denoise the volume in an accurate and efficient manner.
Background
At first glance, a seismic line might look chaotic to the untrained eye, but upon further inspection, a trained eye can often find many features in data. These features are the products of how the data was collected, the geology, and the data processing methods. Sadly seismic data does not always capture a perfect image of the subsurface. In particular, some features get completely obliterated by noise from the way it was collected, processed, and the geology itself. Much like looking down into a pool from above before making a daring escape from the bad guys, the image can be filled with noise from other sources that obscure the different features. Only by filtering out the noise and focusing on the task at hand do the features become clear.
The acquisition, processing, and interpretation of seismic data is worth a library of textbooks, beyond the scope of this challenge. However, by looking through the data for this challenge, anyone can pick out numerous general trends. Some examples are described below and depicted in Figure1:
There is often a dull area on the top of the line which represents the water column; much of this data comes from offshore locations.
Higher frequency reflections are more common in the upper parts of the line, while lower frequencies are more common in the lower parts of the line.
The black and white layers alternate on the line, these represent changes in density of the rocks being measured just like an image from a medical ultrasound device.
Salt appears as a bright reflection followed by a dull area of gray with little texture
Noise often appears as subhorizontal alternating black and white lines, and “smiles” where these noise waves intersect
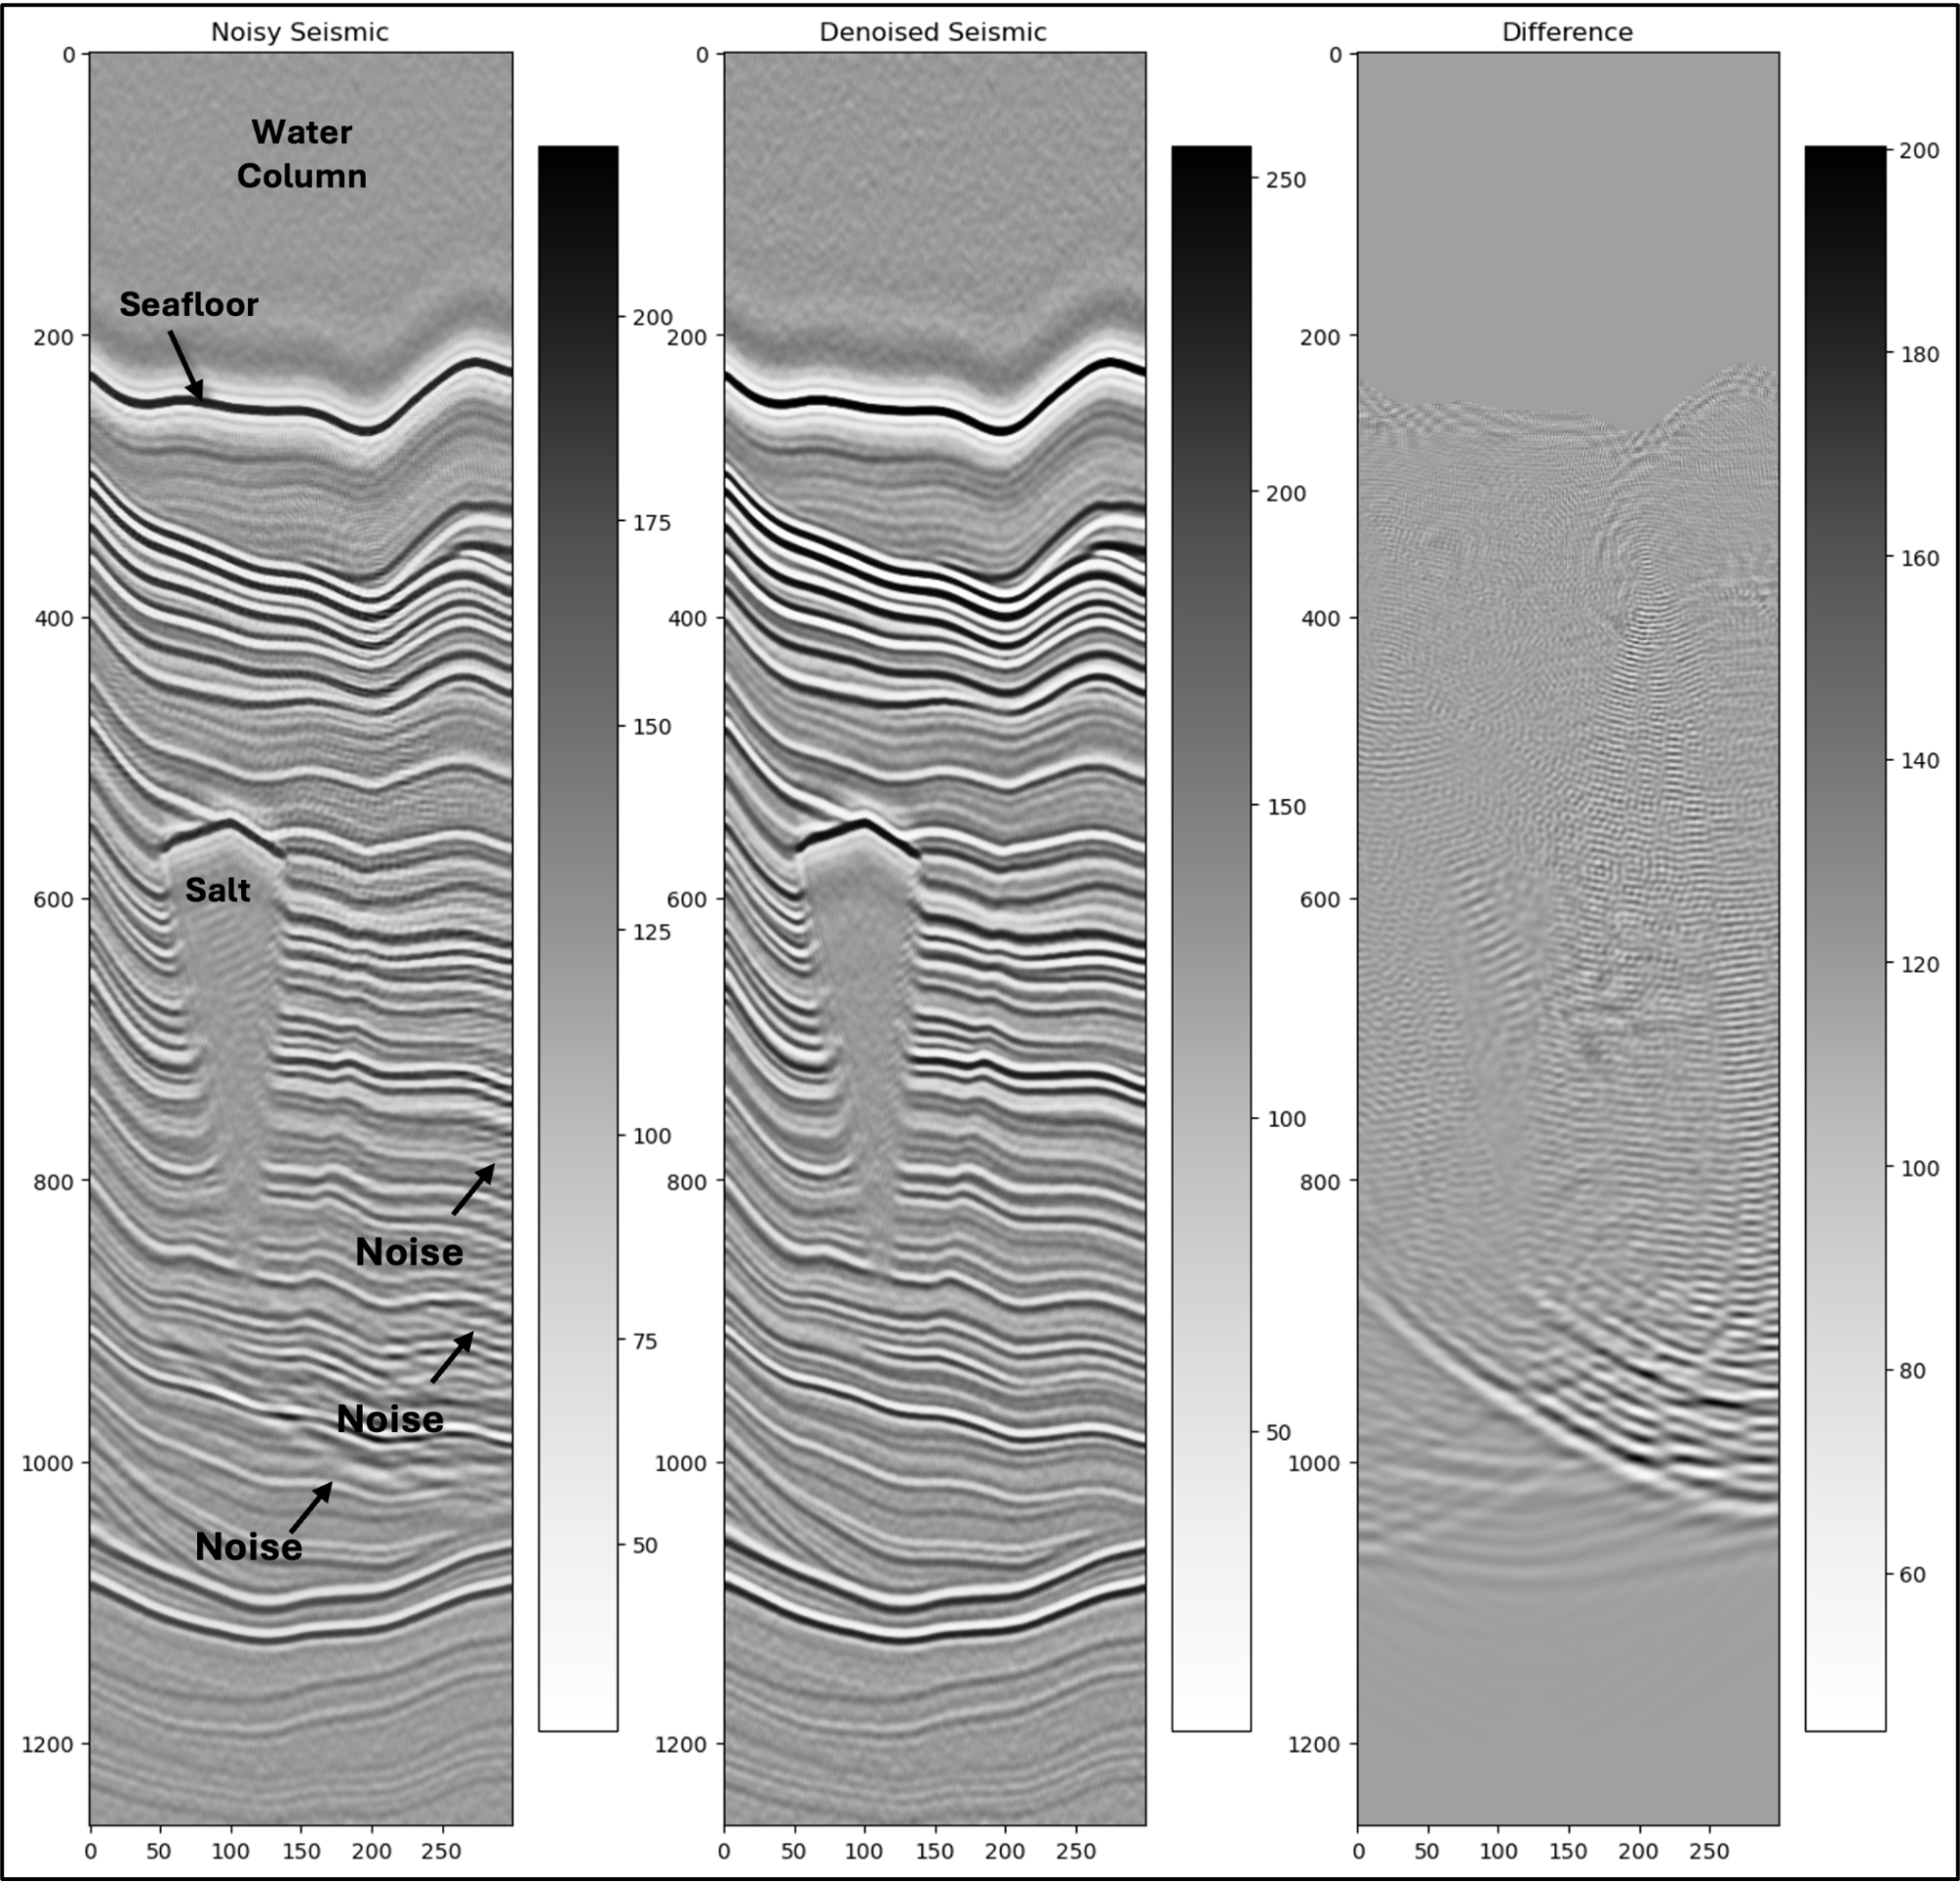
Figure 1. Three seismic images with noisy seismic, denoised seismic, and the difference between the two images
Data
Participants will be provided with 500 paired synthetic seismic datasets. Of the 500 volumes 250 volumes are the noisy seismic, and 250 volumes are the target denoised seismic. The synthetic data will be delivered as Numpy arrays with a shape of (300,300,1259). You are free to use any inline or crosslines from the volumes that you choose for training.
The Image Impeccable: Journey to Clarity Data by Think Onward are licensed under the CC BY 4.0 license (link)
Evaluation
To evaluate the performance of your solution, you will provide a submission file containing six 2D arrays taken from each 3D seismic volume in the test dataset. Instructions and submission file generation code is provided at the bottom of the starter notebook. For this challenge, the leaderboard evaluation will use the scikit-image implementation of the Structural Similarity Index. The Structural Similarity Index is a metric used to measure the similarity between two images. When the SSI equals 1, the images are identical. When the SSI equals 0, the images are completely dissimilar. Please refer to the `scikit-image` docs for more information about the metric, as well as examples of implementation. Similarity will be calculated for all predictions. The minimum and maximum SSI values will be dropped, and the mean SSI score across all predictions will be the final score.
Final Evaluation
For the Final Evaluation, the top submissions on the Predictive Leaderboard will be invited to send ThinkOnward Challenges their fully reproducible Python code to be reviewed by a panel of judges. The judges will run a submitted algorithm on up to an AWS SageMaker g5.12xlarge instance, and inference must run within 24 hours. The SSI score metric used for the Predictive Leaderboard will be used to score final submissions on an unseen hold-out dataset. The score on the hold out dataset will determine 95% of your final score. The remaining 5% of the final score will assess submissions on the interpretability of their submitted Jupyter Notebook. The interpretability criterion focuses on the degree of documentation (i.e., docstrings and markdown), clearly stating variables, and reasonably following standard Python style guidelines. For our recommendations on what we are looking for on interpretability see our example GitHub repository (link).
A successful final submission must contain the following:
Jupyter Notebook: Your notebook should be written in Python and clearly outline the steps in your pipeline
Requirements.txt file: This file should provide instructions on how to run the training and inference for your submission
Supplemental data or code: Include any additional data, scripts, or code that are necessary to accurately reproduce your results
Model Checkpoints (If applicable): Include model checkpoints created during training so we can replicate your results
Software License: An open-source license to accompany your code
Your submission must contain the libraries and their versions and the Python version (>=3.9). See the Starter Notebook on the Data Tab for an example.
Good luck, Challenger.
Timelines and Prizes
Challenge will open on June 26 2024 and close at 22:00 UTC October 18 2024. Winners will be announced on November 22 2024.
The main prize pool will have prizes awarded for the first ($10,000), second ($5,000), and third ($3,000) in the final evaluation. There will be two $1,000 honorable mentions for valid submissions that take novel approaches to solving the problem.