
Completed
The Energy-Efficient Ghosts of Holiday Past
$30,000
Completed 121 weeks ago
195 teams
Ebenezer Scrooge, much to their dislike, is throwing a Holiday Party for everyone in Scrooge and Marley Inc. at his house in Late December. Tiny Tim has requested lights, inflatable decorations, a whole turkey and ham, figgy pudding, and more. Ebenezer can't resist such a request, but his penny-pinching never stops, so he is now preoccupied with the question, WHEN can he have this Party so that he can have the lowest possible electricity bill? Old Scrooge has a knack for accounting but not for data science, which is where you come in. The goal of this challenge is to identify the cheapest 4-hour window to hold the Party and calculate the additional cost of electricity in Scrooge's house during that Party.
Another goal for this challenge, because Scrooge is in a giving spirit, is to build a solution using the open-source Real Time Data Ingestion Platform (RTDIP). This open-source platform enables the ingestion, cleaning, and utilization of sensor data (link). Special prizes will be awarded to those that utilize the RTDIP in exciting ways.
Background
The data for this challenge comes from the NREL's End-Use Load Profiles for the US Residential Building Stock. It contains the energy consumption profiles for Massachusetts households over 2018. This data comprehensively shows how energy usage is divided amongst different types of residences and the appliances that use the energy. Onward has bundled a segment of these data for participants to use in creating their solutions.
This unique challenge also asks you to investigate the RTDIP in creating a solution. The RTDIP is an industry-standard, open-source, scalable solution that enables easy access to high-volume, historical, and real-time process data for analytics applications. This platform is designed to process data from various sources, making it a reliable solution for big data ingestion and processing. One of the goals of this challenge is to enable the growth of the RTDIP by having participants find more use cases, whether data connectors, QC protocols, or visualization tools.
Challenge Structure
At the core of this challenge, you have two goals: electrical load forecasting and finding novel uses for the RTDIP platform. A successful solution for this challenge should encompass the following key aspects:
Forecast the load for the remaining days of December. Specifically, predict the load for three particular elements (two heating-related loads and one plug load: see the starter notebook for details), each of which will surge by 30% during the Party due to increased usage. Account for additional decorative electric devices (holiday lights, holiday inflatables, etc.) during the event, with a fixed total power rating of 2kW.
Utilize your load forecast to estimate the Party load, comprising the 30% increase in the three loads plus the fixed load from the additional devices. Then, calculate the expected Party cost based on this predicted Party load and the Time-of-Use (ToU) electricity pricing.
Identify the continuous four-hour window that offers the most cost-effective electricity rates for Scrooge's Party. This window should correspond to the lowest Party cost within a four-hour duration. Scrooge plans to schedule the four-hour Party any day between December 22nd and the end of December, exclusively from 5:00 PM to midnight.
Use RTDIP functionality somewhere in your solution.
In contrast to a fixed-rate tariff, Time-of-Use (ToU) tariffs feature fluctuating electricity prices across peak and off-peak periods throughout the day. Scrooge's subscribed ToU tariff is outlined as: From 6:00 pm to 10:00 pm, the rate is $0.35 per kWh; outside of this period, the rate stands at $0.20 per kWh.
All submissions must utilize the RTDIP for at least one part of their solution. Potential options include: connecting to external data sources to help your model (i.e., weather), transforming data to be better utilized by models, creating a plugin for a dashboard of energy usage, etc. We are eager to see your creative approaches to using this new platform in the energy space.
One example of integrating sources into your project is that you could connect the Weather API - OpenWeatherMap to extract weather-related information like temperature for the locations listed in the dataset provided. Any publicly-available datasets are welcome for you to integrate into your challenge code with RTDIP.
Data
The dataset provided for this challenge comprises time-series load profiles from January 1st to December 21st for 201 residential buildings. Among these buildings, there's Scrooge’s House and 200 other dwelling units. Each building encompasses various load profiles, capturing energy consumption patterns of distinct appliances like plug load, heating, lighting, and more. Figure 1 showcases five of these load profiles for Scrooge’s House, specifically from December 1st to the end of December 6th. These files are titled as <building_id>.parquet, with building_id representing the unique building ID. Building IDs range numerically from 1 to 200, representing the 200 distinct buildings, and scrooge_bldg designates the Scrooge House. Please note that these building IDs do not correspond to the same IDs in the original NREL’s EULP dataset.
In addition to the load profile dataset mentioned above, we're providing metadata for the 200 buildings and Scrooge’s House in metadata.parquet and scrooge_metadata.parquet files, respectively. This metadata comprises valuable details about building characteristics, including house size in square feet, type of house, climate region, number of bedrooms, location details, appliance specifications, construction date and materials, heating and cooling specifics, and various other relevant features.
We're also providing two files: data_dictionary.tsv and enumeration_dictionary.tsv. The former acts as a reference guide for building characteristics and load profiles available across the dwelling units, while the latter serves as a guide outlining the available options for each building characteristic. These files are designed to assist in comprehending the meaning of various variables found in both time series and metadata. They offer descriptions for all load variables and metadata fields.
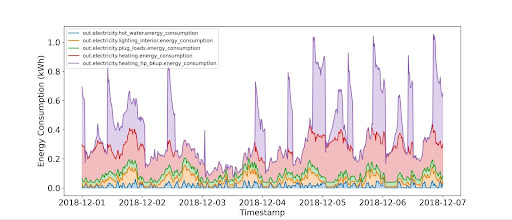
Figure 1. Load profiles for five specific loads in the Scrooge House from Dec 1st till the end of Dec 6.
RTDIP
The Real Time Data Ingestion Platform (RTDIP) is an open-source platform used to support advanced Data Science, statistical and machine learning tasks such as predictive analytics, forecasting, optimization, surveillance as well as other day-to-day operations. RTDIP interfaces with a variety of data sources such as OPC Servers, REST API’s, IoT Sensors, robots and drones to ingest a variety of data types such as time series, alarms, video, photos, and audio.
In addition to its data ingestion capabilities, RTDIP enables the transformation of data through common transformations. Furthermore, it supports writing data to multiple end destination data sinks. To get started with RTDIP, please visit the installation page (link) and follow the steps to install it on your machine.

The RTDIP documentation includes some great examples to illustrate the ways you can ingest data. For example, you might find the Weather Forecast API V1 to be useful for collecting weather data. Additionally, you might find the PJM Daily Load Local to be a useful example of how to pull real-time electricity data from a regional transmission organization.
Evaluation
To evaluate your solution's performance, you'll need to submit a CSV file showcasing the Party cost forecast within a four-hour window, segmented into 15-minute intervals. This submission should consist of two columns: one for timestamps and another for party costs, totaling 16 rows. Evaluation of your submission entails a two-part metric assessment. First, your forecasted Party cost will be compared to the ground-truth Party cost for the submitted four-hour period, calculating the root-mean-square error. Next, your submitted total Party cost over the four-hour window will be assessed against the optimal total Party cost, determining the absolute error. These error values will be scaled and combined to generate your final submission error that is reported as your score on the Predictive Leaderboard. Lower error scores indicate better solutions.
We've included a sample_submission_generator() function in the utils.py module that generates and saves a sample submission file in CSV format (with random Party cost values), illustrating the expected format. Additionally, you'll find a sample submission file in the sample_submissions folder. To aid your understanding, we've provided the scoring algorithm along with a CSV file in the sample_submissions folder, demonstrating how submissions are evaluated and scores are calculated using mock ground-truth Party cost values.
For the final evaluation, the top submissions on the Predictive Leaderboard will be invited to send Onward their fully reproducible code, which includes any additional data used to build a model. The submission should contain a Jupyter Notebook (Python >3.6) with a clearly written pipeline and any necessary supplements to reproduce your results. The leaderboard score will account for 95% of the participant's final score.
Submissions will also be assessed for the interpretability of their submitted code. The interpretability criterion will focus on the extent of documentation, including docstrings and markdown, clear variable naming, and adherence to standard Python style guidelines. Interpretability counts for 5% of a participant's final score. Remember, you need to use RTDIP in at least one way in your submission, such as a connection or transformation.
RTDIP has an open-source license to build on the open culture of collaboration and knowledge sharing. This means that all submissions must be open source. This helps inspire others to build on your work, amplify your impact by sharing your solutions with the global community, and encourages peer review and collaboration. Open-source licenses are like the Ghosts of Holiday Present, Past, and Future, bringing generous spirits to this challenge and making sure Scrooge continues to share joy, collaboration, and innovation.
Timelines and Prizes
Challenge will open on December 20, 2023 and close on March 22, 2024 at 22:00 UTC.
There will be a total prize pool of $30,000 for this challenge. There will be different prize levels for challenges:
First place ($11,000)
Second place ($8,000)
Third place ($5,000)
Six Honorable Mentions ($1,000)
Most non-trivial RTDIP uses (connectors, transformers, sinks etc.)
Most interpretable and well documented notebook
Best holiday themed data visualization
Most novel approach or new insights
A new data transformation that can be integrated into the RTDIP repository
A new data connector that can be integrated into the RTDIP repository
You can be awarded multiple honorable mentions or combine main and honorable mention prizes.
References
National Renewable Energy Laboratory (NREL). (2021). End-Use Load Profiles for the U.S. Building Stock [data set]. Retrieved from https://dx.doi.org/10.25984/1876417.