
Data Science
Machine Learning
Time Series
Unsupervised Learning
Completed
Dynamic Rhythms
$20,000
Completed 63 weeks ago
359 teams
Overview
In this challenge, you'll be tasked with developing a model to predict power outages and how they correlate with extreme, rare weather events (e.g. storms). Your goal is to create a reliable system that can accurately predict these outages. You'll have access to a dataset containing historical weather data and relevant power outages. Your task is to design a model that can effectively forecast future weather impacts on power outages. You're free to explore and experiment with various algorithms, techniques, and models to achieve accurate results.
To make things more interesting, we've identified two primary datasets: a storm event dataset and a power outage dataset. These dual datasets will require you to develop a robust model that can adapt to different scenarios and provide accurate forecasts. In addition to the top-performing model, you'll have the opportunity to win prizes for honorable mentions. Will you rise to the challenge and become a top forecaster?
Missed the challenge launch event? Watch it now to gain valuable insights, explore suggested modeling approaches, and get submission tips to boost your strategy!
Background
Predicting power outages is crucial for utility companies, emergency responders, and customers to minimize the impact of disruptions. During natural disasters and extreme weather events, power infrastructure is at high risk (Figure 1), making accurate predictions vital for preparedness and resilience. Here’s why it matters:
Enhancing Public Safety:
Power failures can be life-threatening, especially for vulnerable populations (elderly, medical patients relying on electric devices like ventilators or dialysis machines).
Preemptive warnings allow hospitals, emergency services, and individuals to prepare, ensuring backup power sources are available.
Faster Power Restoration:
Utilities can pre-position repair crews and equipment based on outage predictions, reducing response times.
Proactive planning prevents prolonged blackouts, limiting economic and social disruptions.
Reducing Economic Losses:
Businesses, industries, and households depend on power for operations.
Predicting outages allows businesses to implement backup solutions (e.g., generators, alternative energy sources) before disruptions occur.
Preventing spoilage in food storage and pharmaceutical industries.
Preventing Grid Overload and Failures:
Rare weather events (like extreme heat or cold waves) cause surges in energy demand, increasing the likelihood of equipment failures.
Utilities can adjust load balancing and activate demand-response programs ahead of time to prevent large-scale grid collapses.
Improving Emergency Response and Disaster Management:
Emergency services rely on electricity for communication, coordination, and life-saving infrastructure.
Predicting outages allows cities to pre-position first responders and ensure critical facilities have power backup.
Enhancing Customer Preparedness:
If customers know an outage is likely, they can:
Charge devices and stock up on essentials.
Secure backup power (e.g., generators, battery packs).
Plan for alternative shelter if necessary.
Minimizing Damage to Electrical Infrastructure:
Extreme weather can cause cascading failures in power grids (e.g., fallen trees damaging power lines, floods affecting substations).
Predictive analytics help utilities take preventive action, such as shutting down at-risk lines to prevent damage.
In this challenge, you will be using public data to build your forecasting models. By contributing to this challenge, you can help advance the state-of-the-art in rare event forecasting and power outage prediction, and hence, contribute to a more sustainable, efficient, and responsive energy system.
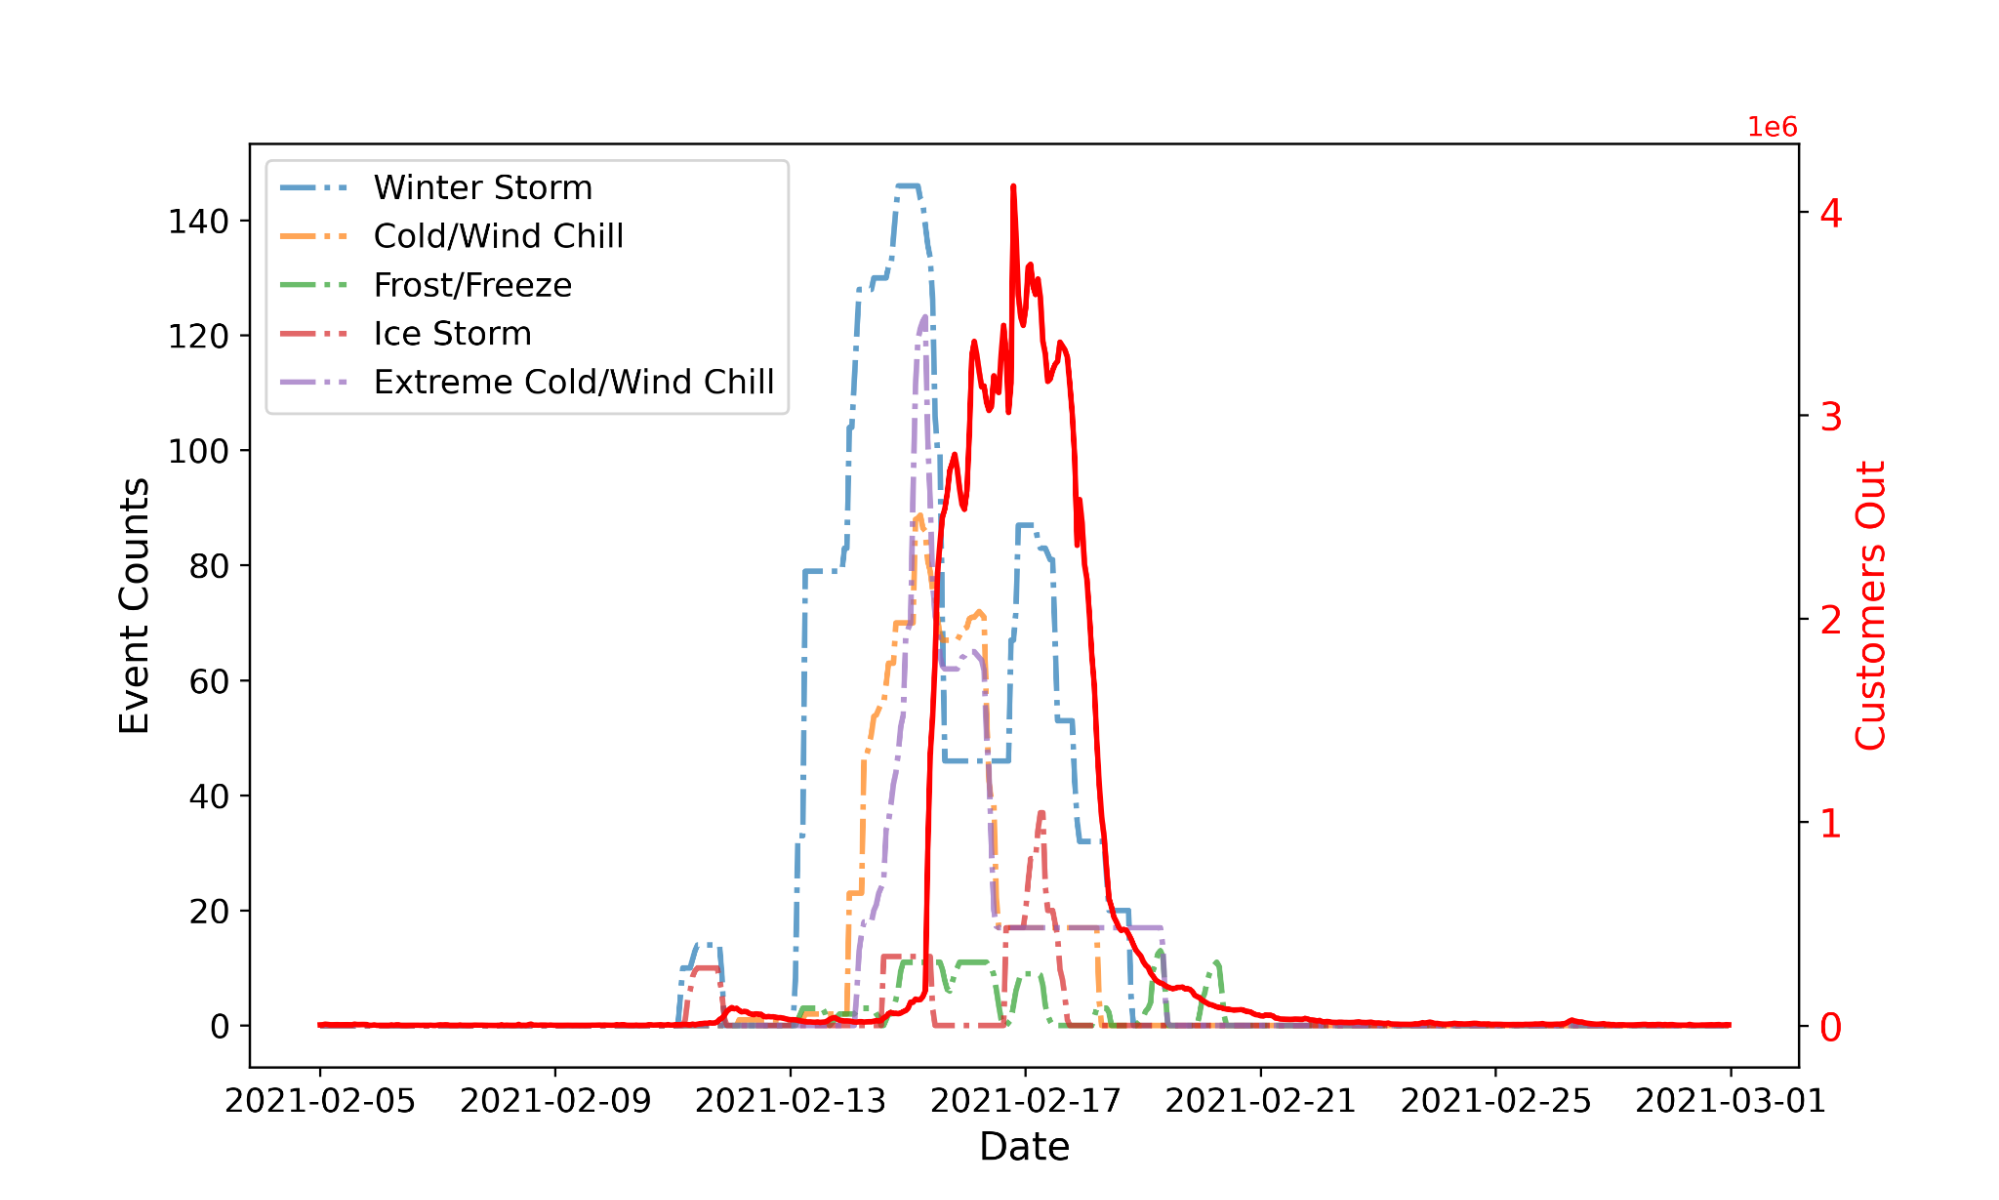
Figure 1. This figure depicts the number of Texas customers experiencing power outages over time, and the occurrence of five storm events during the Great Texas Freeze in February 2021. This highlights the significant impact of severe storms on the power grid.
Data
In this challenge, we provide two public datasets to help you get started and run the provided Starter notebook. The first dataset includes power outages in the U.S. from 2014 to 2023, containing information on the number of customers without power every 15 minutes at the county level (please refer to reference [1] on the Data tab for more details about this dataset). The second dataset covers storm events in the U.S. from 2014 to 2024, compiled from NOAA’s storm event database (see reference [2] on the Data tab for more information). This is a subset of a larger dataset available via NOAA’s storm events database website.
We encourage you to explore NOAA’s or any other publicly available datasets on extreme weather events to build and train a robust predictive model. Meteorological weather data is essential for forecasting extreme weather events and predicting power outages. One comprehensive weather dataset is ERA5, which includes a wide range of meteorological variables dating back to 1959. You can access this dataset from the Copernicus Climate Data Store or download it directly from sources like Google’s WeatherBench2 website.
We would like to emphasize that you are not limited to the datasets we provide or mention above. In fact, we highly encourage you to use any publicly available external data sources that you find useful for building and training your predictive model. For instance, you may find that data on vegetation indices or population vulnerability can provide insights into the severity of power outages.
Having developed a robust rare-event forecasting and power outage prediction model, you’ll need to evaluate the performance of your approach on unseen data. Since this is an unstructured Challenge, you will be responsible for designing your own train, test, and hold-out splits, as well as creating custom metrics and evaluation scripts. A good model should not only capture whether and where an outage occurs, but also predict it sufficiently early to allow proactive measures. Moreover, modeling the severity and duration of outages is essential for assessing potential impacts on communities.
When designing your performance metrics, consider that a single metric may not capture all of these dimensions. You might combine specialized metrics for rare-event classification (e.g., precision-recall for imbalanced data) with lead-time accuracy (e.g., mean time-to-event error) and severity predictions (e.g., error in forecasted duration or number of customers affected). You should also incorporate location accuracy for geospatially precise predictions. Ultimately, your goal is to develop a well-rounded evaluation that reflects how reliably and how early your model can forecast significant power outages.
The Challenges community is known for its creativity, and we’re excited to see your innovative solutions to this problem!
Evaluation
To evaluate your submission, you'll need to submit a zip file containing your analysis code and any additional scripts to download public datasets you used in your analysis. Please do not include the dataset that we have provided. To score your submission we will use the following rubric:
Data Handling & Preprocessing (20%):
How well participants clean, merge, and align multiple data sources (e.g., EAGLE-i outage data, NOAA storm events, ERA5, etc.).
Treatment of missing values, time alignment (for forecast lead times), and spatial aggregation.
Understanding the data and problem complexity via EDA and basic statistics
Feature Engineering & Justification (15%):
Creating meaningful features that capture meteorological indicators, location-based attributes, and temporal trends (e.g., lead-lag features for storms).
Clear reasoning behind feature selection and relevance to power outages.
Model Development & Performance (40%):
Choice of models/algorithms and suitability for rare event forecasting (classification/regression/time-series).
Handling spatio-temporal aspects, severity (duration/size) of outages, and lead-time predictions.
Evidence of rigorous evaluation (using performance metrics relevant to rare events, e.g., recall, lead-time error, etc.).
Interpretability & Insights (15%):
Ability to explain the model’s predictions (e.g., which features are most influential).
Domain insights: demonstrating an understanding of how/why certain storms correlate with outages.
Solution Clarity & Reproducibility (10%):
Code organization, clarity, documentation, and reproducibility.
Overall adherence to submission guidelines, including external data usage and licensing compliance.
The judges will run the submitted algorithm on AWS SageMaker, and will use up to a g5.12xlarge instance. Model inference on your holdout dataset must run within 1 hour. If the code cannot run in the allotted time, the challenger will be notified and given 24 hours to make edits. If no edits are made, the submission will be disqualified. Participants are limited to one (1) submission per day. However, only the most recent submission will be judged at the close of the Challenge.
A successful final submission must contain the following:
Jupyter Notebook: Your notebook will be written in Python and clearly outline the steps in your pipeline
Requirements.txt file: This file will provide all required packages we need to run the training and inference for your submission
Supplemental data or code: Include any additional data, scripts, or code that are necessary to accurately reproduce your results, please do not include the data we provided you
Model Checkpoints (If applicable): Include model checkpoints created during training so we can replicate your results
Software License: An open-source license to accompany your code
Your submission must contain the libraries and their versions and the Python version (>=3.10). See the Starter Notebook on the Data Tab for an example.
Timeline and Prizes
The challenge will open on 5 February 2025 and close at 22:00 UTC on 1 May 2025. Winners will be announced on 13 June 2025. The total prize pool is $20,000, to be awarded as follows:
1st Place: $7,000
2nd Place: $5,000
3rd Place: $3,000
4th Place: $2,000
5th Place: $1,000
In addition, there will be two Honorable Mentions, each worth $1,000:
Earliest Top-Five Submission: Awarded to the competitor whose final entry among all top-five finalists has the earliest submission timestamp. (Note that each participant can submit updated solutions throughout the challenge; we will look at the final solutions that place in the top five and identify who submitted earliest.)
Best Documentation, Analysis, & Insights: Awarded to the submission that demonstrates exceptionally clear documentation, thorough exploratory data analysis (EDA), strong interpretability, and insightful discussion of the results. This recognizes solutions that go above and beyond in explaining how and why their model works, highlighting domain reasoning, and providing meaningful visualizations or explanatory narratives.