
Time Series
Classification
Completed
Building Instinct: Where power meets predictions
$15,000
Completed 93 weeks ago
305 teams
Overview
For this challenge, we’ve provided you with a series of load profile time-series for a variety of different building classes. Your job is to build a model that can take in a time-series load profile and predict the building class. This hierarchical classification problem requires you to classify each building in the dataset and predict its attributes and metadata.
Background
This is the next in the line of power focused challenges that challenge you to analyze power and consumption data. In the Ghosts of Holiday Past challenge, we introduced you to load forecasting, while in the Power Patterns challenge we asked you to do analysis on load profiles and recommend a demand-response program, e.g. time of use tariff structure for different groups of load profiles. In this challenge we are asking you to solve a hierarchical classification problem based on building load profiles.
Have you ever wondered what type of building uses the most amount of energy on a warm summer afternoon? What about ways you could outsmart your electric bill and survive the high costs of summer? No matter the city, district, or country, every building that uses electricity has a unique electricity consumption signature which depends on many different features. For example, a single family home will have a different load profile than a hotel, which has a different profile than a warehouse. These load profiles record the customers electric consumption patterns, typically in real-time. These load profiles help electric utilities understand behaviors and preferences, along with identifying big consumers of power. Building load profiles record energy usage throughout the day, with peaks during high consumption, and valleys during low consumption. Analyzing these patterns is important for electric utilities to make sure that time of use tariffs and other demand response programs are marketed to the correct types of building owners.
Identifying buildings attributes (e.g., whether it is residential or commercial, vacant or occupied, or whether it has a small or large square-footage) allows utilities to outsmart consumption patterns by targeting specific groups to participate in demand response initiatives. For example, commercial buildings with high energy usage during peak hours could be charged a higher rate to encourage a reduction in consumption during times of high demand. This in turn could alleviate strain and congestion on the grid, and avoid expensive peak energy costs.
Beyond utility companies and demand-response programs, this classification challenge has several other significant applications. Urban planners and policymakers can use the insights from building load profiles to design more energy-efficient cities and neighborhoods. By understanding the consumption patterns of different building types, they can implement zoning regulations and incentives that promote sustainable energy use. For instance, identifying commercial buildings that have inefficient heating/cooling systems –that results in high energy consumption– can lead to targeted initiatives for energy retrofits and improvements in those areas. Additionally, real estate developers and property managers can leverage this data to enhance the energy efficiency of their buildings, thereby reducing operational costs and improving the marketability of their properties.
Furthermore, energy consulting firms can utilize these classification models to offer tailored energy-saving recommendations to clients, helping them to reduce their carbon footprint and operational expenses. In the realm of smart cities, integrating building load profile data with IoT devices can lead to more responsive and adaptive energy management systems, ensuring optimal energy distribution and usage across urban landscapes.
Data
The dataset provided for this challenge comprises time-stamped electricity load profiles from January 1st to December 31st for 7200 and 1440 buildings in the train and test datasets, respectively. These files are titled as <building_id>.parquet, with building_id representing the unique building ID. Building IDs range numerically from 1 to 7200 (or 1440), representing the 7200 distinct buildings in the train (or test) datasets. Please note that these building IDs do not correspond to the same IDs in the original NREL’s EULP dataset.
In addition to the load profile dataset, we're providing metadata for 7200 buildings in the train_label.parquet file. This metadata file contains valuable information about building characteristics, including building stock type and other attributes such as square footage, construction date, materials, and heating and cooling specifics, depending on the building’s stock type. Buildings are classified as either residential or commercial, as indicated in the building_stock_type column.
For commercial buildings, there are 11 specific metadata attributes available, stored in columns ending with _com. These attributes provide insights into the unique characteristics of commercial buildings. For residential buildings, there are 13 specific metadata attributes available, stored in columns ending with _res, offering detailed information pertinent to residential structures. Figure 1 illustrates the unnormalized distribution (building counts) of different classes within two metadata attributes for both residential and commercial building stocks in the training dataset. These four attributes are chosen solely for demonstrative purposes to highlight the diversity and imbalance in the distributions.
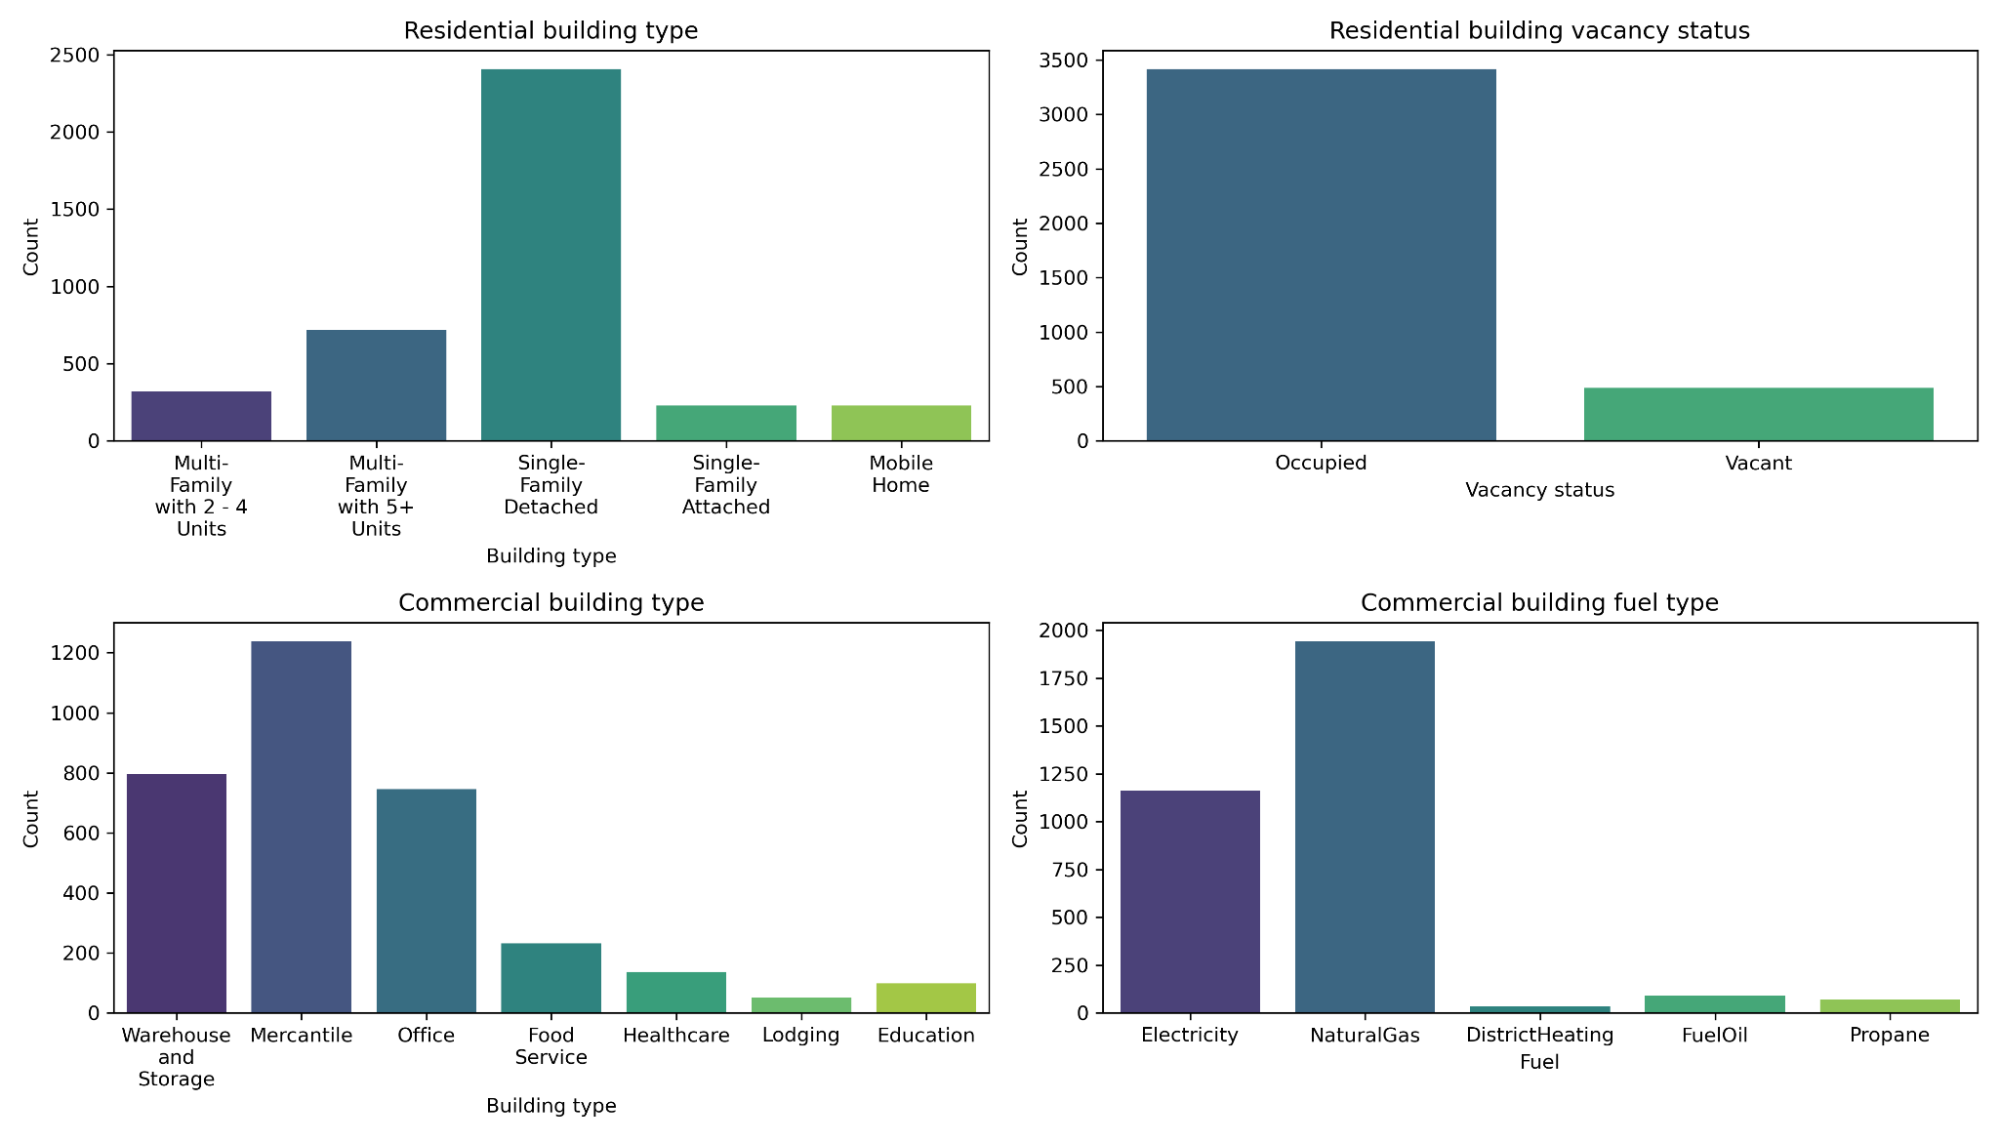
Figure 1. Unnormalized distribution (building counts) of different classes for residential building type and vacancy status (first row) and commercial building type and fuel type (second row)
Your task in this challenge is to classify (i.e., predict the classes for) each metadata target variable for a given building based on its electricity load profile. The process begins with classifying the building_stock_type (a binary classification: residential or commercial). If the building is classified as residential, you should then predict the classes for (i.e., classify) all 13 corresponding metadata target variables (columns ending with _res). Similarly, if the building is classified as commercial, you should predict the classes for all 11 corresponding metadata target variables (columns ending with _com).
This is a hierarchical classification problem with two levels (hierarchies) of classification: The first level involves determining the building stock type, and the second level involves classifying the target variables specific to the first-level class. Additionally, this is a multi-output classification problem since there are multiple target variables to classify (13 for residential and 11 for commercial). Furthermore, it is a multi-class problem because many target variables have more than two classes.
Evaluation
Final Evaluation
For the Final Evaluation, the top submissions on the Predictive Leaderboard will be invited to send ThinkOnward Challenges their fully reproducible Python code to be reviewed by a panel of judges. The judges will run a submitted algorithm on up to an AWS SageMaker g5.12xlarge instance, and inference must run within 24 hours. If the code cannot run in the allotted time, the challenger will be notified and given 24 hours to make edits. If no edits are made, the submission will be disqualified. The scoring metric used for the Predictive Leaderboard will be used to score final submissions on an unseen hold-out dataset. The score on the hold out dataset will determine 95% of your final score. The remaining 5% of the final score will assess submissions on the interpretability of their submitted Jupyter Notebook. The interpretability criterion focuses on the degree of documentation (i.e., docstrings and markdown), clearly stating variables, and reasonably following standard Python style guidelines. For our recommendations on what we are looking for on interpretability see our example GitHub repository (link).
A successful final submission must contain the following:
Jupyter Notebook: Your notebook should be written in Python and clearly outline the steps in your pipeline
Requirements.txt file: This file should provide instructions on how to run the training and inference for your submission
Supplemental data or code: Include any additional data, scripts, or code that are necessary to accurately reproduce your results
Model Checkpoints (If applicable): Include model checkpoints created during training so we can replicate your results
Software License: An open-source license to accompany your code
Your submission must contain the libraries and their versions and the Python version (>=3.9). See the Starter Notebook on the Data Tab for an example.
Timelines and Prizes
Challenge will open on July 9, 2024 and close at 22:00 UTC October 2, 2024. Winners will be announced on November 8, 2024.
The main prize pool will have prizes awarded for the first ($6,000), second ($4,000), and third ($2,000) in the final evaluation. There will be three $1,000 honorable mentions for valid submissions that take novel approaches to solving the problem.