
Supervised Learning
Completed
Put it on the Map!
$25,000
Completed 327 weeks ago
0 teams
Description
Understanding where, geographically, a piece of data comes from is critical for geoscientists. Location gives context and allows links to be made with other pieces of data and ideas. “Put it on a map.” is the best advice you can give a geoscientist struggling to understand a problem. As more geoscience data becomes digital, there’s a growing problem of legacy maps getting left behind. These maps are images in reports, articles, or presentations that have lost their real-world coordinates. For the last decade, geoscientists have been manually assigning coordinates to map images to preserve these data, which can be a time-consuming task and only addresses a portion of the maps needing attention. Geoscientists need a tool that can approximate the location of millions of images so that they can be preserved and utilized by others.
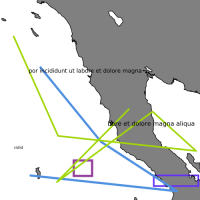
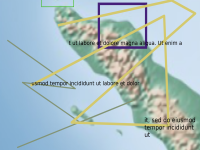
In this challenge, you’ll need to train an algorithm that can accurately predict the location of a map image based on the features contained within the map (i.e., coastlines, rivers, environments). To build this algorithm, you are given 40,000 map images with known coordinates.
Evaluation
The data for this challenge consists of 40,000 map images (75/25 train, test split). A separate CSV file contains the image’s name and the latitude, longitude of its lower-left and upper right corners.
Your algorithm must accurately predict the latitude, longitude for these two corners based on the details within the map image. The latitude, longitude values are in decimal degrees using the WGS84 projection. The map images are medium to small scale from across the globe, except for near the poles and small isolated islands. The maps can have one of three different map projections and of three different styles (see sample data). Random text, lines, and polygons have been added to simulate annotations on real world maps.

The data on these maps come from Natural Earth (naturalearthdata.com).
https://www.naturalearthdata.com/about/terms-of-use/

Judging Criteria
At Xeek, we are looking for the “best” solution to a problem, but also solutions that can be efficiently run in production. Xeek challenges relate to real business problems, so solutions must also fit within a real business context. For this challenge, we will be judging submissions not only on the accuracy of the model but also the time it takes to train and run the model. The judging for this challenge will consist of two phases.
Phase 1 will be a traditional, accuracy based scoring of solutions against the test data. We will calculate the Root Mean Square Error (RSME) of each row in the test data set, and if the sum of each row of a contestant’s RSME reaches a maximum of 18,000, they will move onto the next phase of the competition. See Accuracy Scoring below for more detail.
In Phase 2, the scoring algorithm changes to a weighted score of accuracy (70%), training time (15%), and inference time (15%). The standard for judging training and inference time will be a SageMaker ml.p2.xlarge instance. You can learn more about the specifications for this instance here: https://aws.amazon.com/sagemaker/pricing/instance-types/
Any submission with a training time above 24 hours will not be considered for the final leaderboard. With these modified judging criteria, we hope to find solutions that better match the conditions that businesses need to use an algorithm.
Submission Process
To be considered for the leaderboard in phase one, please submit a .csv prediction file for accuracy scoring. We will expect a file with 10,001 rows (inclusive of a header row) and 6 columns. Please see the data tab for additional prediction submission format information. Contestants can submit up to 5 times per day for the duration of the challenge, and their highest score will appear on the leaderboard.
Only submissions that reach it to Stage 2 (and thus have an accuracy sum RSME under 18,000) will be considered for the final prize. In stage 2, in order to be considered for the final prize please submit two ipython notebook (*.ipynb) files in the following format before the conclusion of the challenge:
train.ipynb file, which contains the training procedure and at the end saves the model into a pb/h5/pickle file. The timing for running this file from top to bottom will be counted as training time.
inference.ipynb file, which loads the models files and runs the model on test data set and saves the results in the submission.csv file. The timing for running this file from top to bottom will be counted as inference time.
We will update the path to train and test files in train.ipynb -- if needed -- and then run it as
>> time runipy -o train.ipynb. This will evaluate training time and save the models into h5/pickle files.
We will update the pb/h5/pickle file path and test file path in inference.ipynb and run it as
>> time runpy -o inference.ipynb. This will evaluate the inference time and then we calculate accuracy using the submission file generated in this phase.
Accuracy Scoring
To determine an accuracy score, we will calculate the Root Square Mean Error (RSME) for each row of a data set. For Phase I, we will take the sum RSME of each row in the provided test data set. To determine accuracy in Phase II, we will run a private data set against contestant submitted models to calculate the sum RSME.
The equation we will use to calculate RSME is:

Final Model Scoring
As noted above, we will use a weighted score of accuracy (70%), training time (15%), and inference time (15%) to determine the final leaderboard. To do this, we will calculate how many standard deviations a contestant’s submission is away from the mean of all submissions in the three categories, and weigh them appropriately. The equation we will use to calculate the final score is:

In final model scoring, we will calculate these three metrics based off of a private data set. If a user’s submitted model does not hit the accuracy threshold outlined in the first phase, it will not be considered for the final leaderboard.