
Artificial Intelligence
Data Science
Generative AI
Reinforcement Learning
Time Series
Completed
Heat Signature Zero
$20,000
Completed 23 weeks ago
229 teams
Overview
Welcome, Challenger to Heat Signature Zero, a challenge where physics meets intelligent optimization! You may not have your final stripes yet, but your mission is to uncover the hidden heat sources behind complex thermal patterns. Using distributed temperature time-series data from a 2D thermal plate, you must infer the locations and intensities of the heat sources that generated these signals.
If you stick around, you'll see that this Challenge is not about brute-force searches or massive end-to-end ML models. We want smart, adaptive strategies that leverage the provided simulation engine as an active partner during inference. Your solution should iteratively refine source parameters using simulation feedback, moving toward optimal configurations efficiently and intelligently.
This challenge is designed to push the boundaries of simulation-driven parameter estimation. Can you build a solution that combines data science, optimization, and physics-informed reasoning? Let’s put on our thermal vision goggles and take a look.
Missed the launch webinar? Watch the recording (link) Passcode: @4a*1Y7H
Background
At the heart of this challenge lies the physics of heat diffusion, governed by the heat equation. This is a classic parabolic PDE. Heat applied to a plate spreads over time, creating smooth temperature fields. The inverse problem of identifying the original heat sources from sparse sensor readings is inherently ill-posed: multiple source configurations can produce similar observations.
To tackle this, we provide a robust thermal simulation engine (Figure 1). But the goal is not just to generate synthetic data. Instead, it’s to use the simulator intelligently during inference. Instead of brute-force grid searches or one-shot ML predictions, we encourage approaches that adaptively explore the parameter space, guided by simulation feedback.
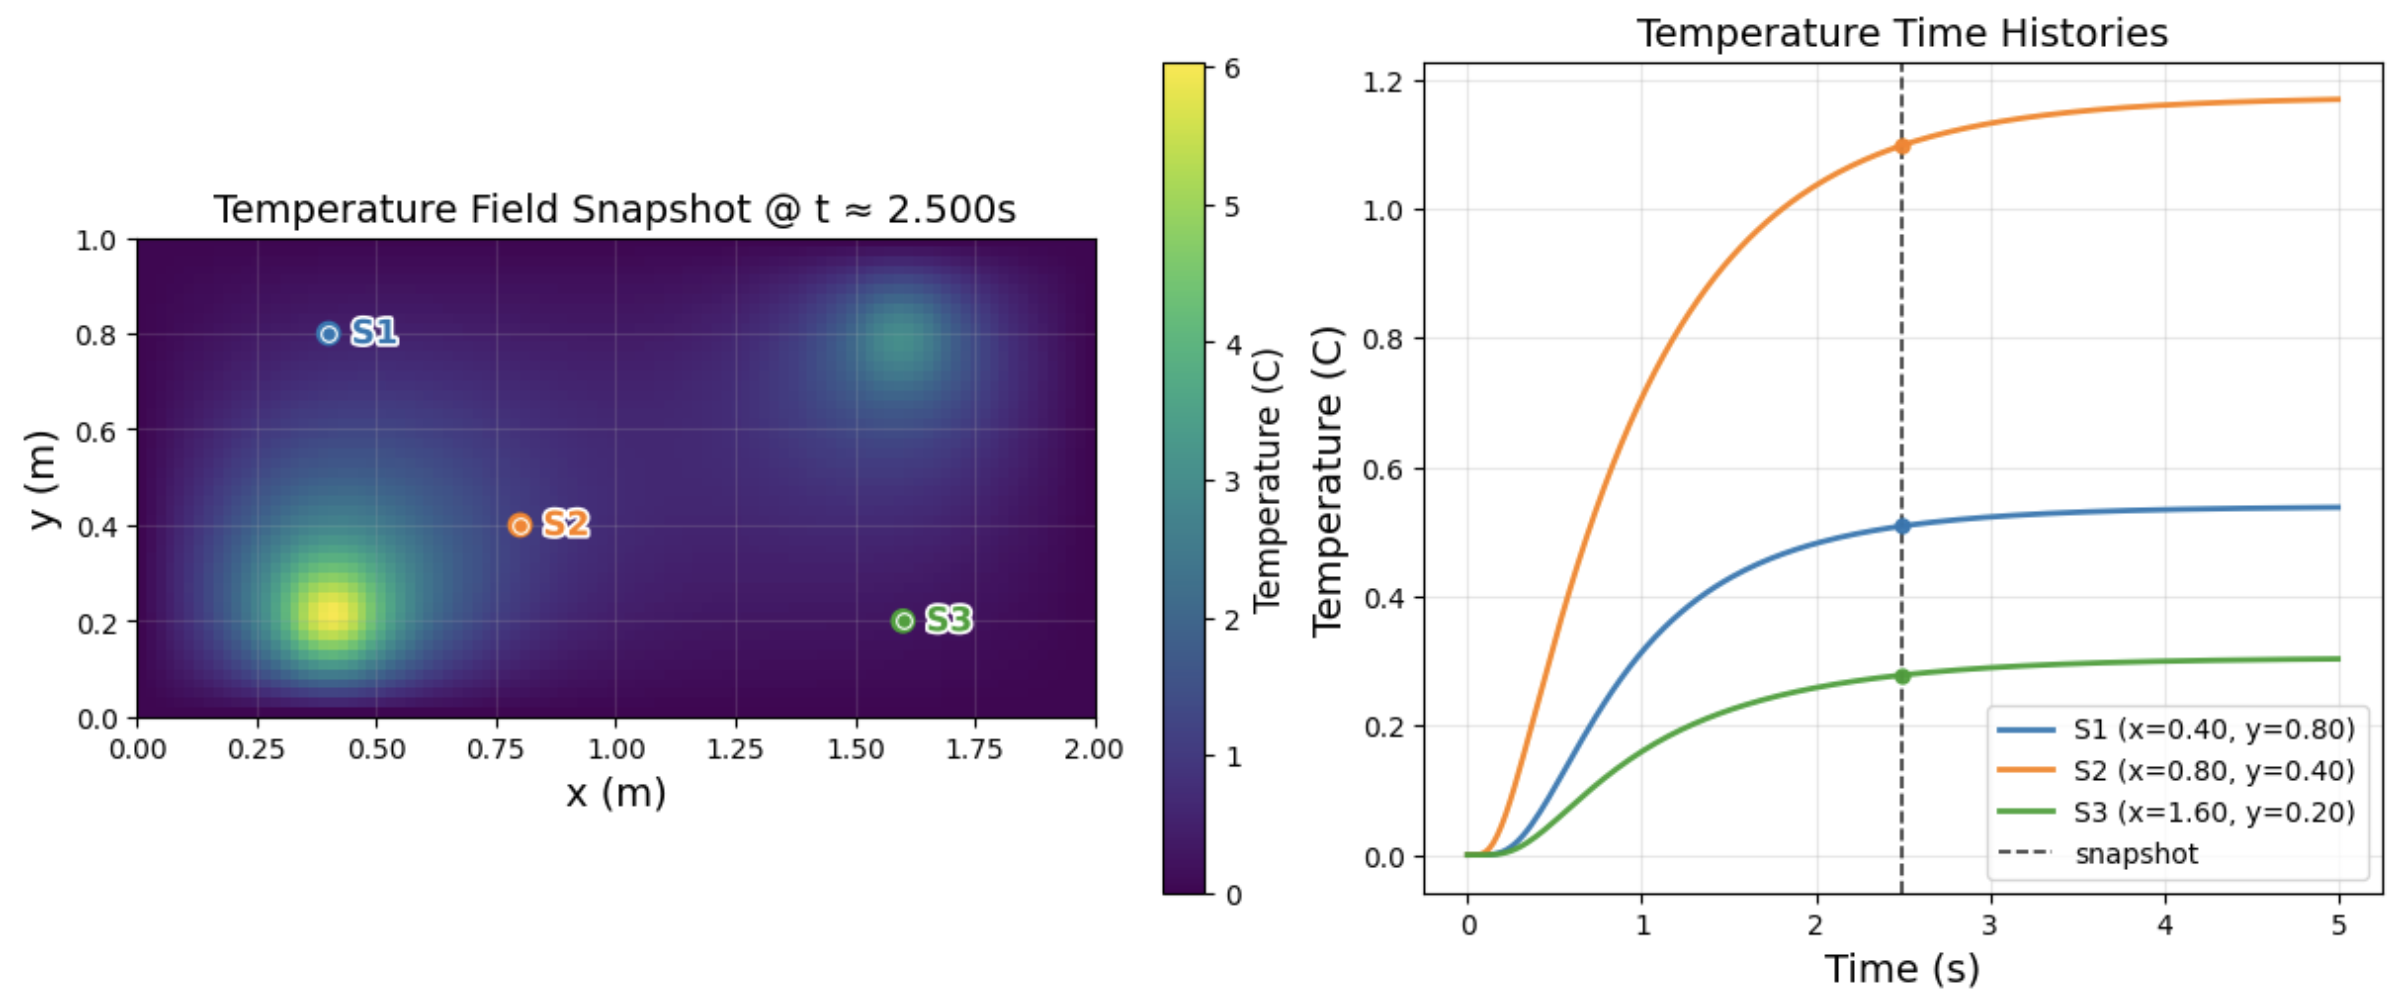
Figure 1. The temperature map and sensor data for one thermal simulation.
Why does this mission matter? Because the techniques you develop here can generalize to a wide range of simulation-driven problems in engineering, energy systems, and beyond. Innovative strategies such as Bayesian optimization, reinforcement learning, meta-learning, or hybrid physics-informed models are key to success. Show us how you can combine efficiency, creativity, and physics to solve this complex inverse problem.
Data
The Starter Notebook provides code to generate a dataset that links historical thermal pulse inputs to the resulting thermal behavior of the 2D tracking plate.
Input Data: The input consists of time-series measurements capturing the temperature evolution at specific coordinates on the plate. Each time series represents the thermal history for a single location over a defined time window, effectively forming a 1D temperature profile per point.
Target Output: Your task is to identify heat sources and their parameters (location and intensity) that best explain the observed thermal patterns. These parameters represent the underlying physical drivers of the thermal dynamics.
You must design a method that ingests the time-series data and infers the set of heat sources responsible for the observed thermal behavior.
To support your efforts, we provide a thermal simulation engine to generate synthetic data. However, this simulator is not just for creating training datasets. We strongly encourage you to integrate the simulator into their inference process, using it intelligently to iteratively refine parameter estimates, validate hypotheses, and guide optimization. The goal is to move beyond brute-force grid search and toward smart, adaptive strategies that leverage simulation feedback to efficiently converge on optimal source parameters. Data augmentation and preprocessing are allowed and encouraged, but the most innovative solutions will use the simulator as an active component of the modeling pipeline.
Evaluation
Submissions are evaluated using a composite metric that balances two key aspects:
Accuracy: How well estimated sources reproduce the ground-truth sensor temperature profiles. This is measured by the Forward Loss, which is the root mean square error (RMSE) between the actual sensor temperatures and those predicted from the estimated source candidates.
Diversity: How many distinct source candidates are provided per sample, up to a maximum limit, ensuring they are meaningfully different.
For each sample, the performance score P is:
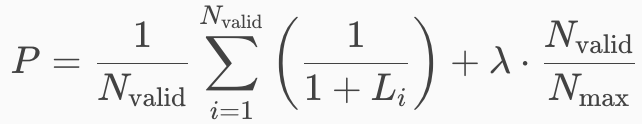
Where:
L_i : Forward Loss for candidate i (lower is better).
N_valid : Number of distinct candidates passing the dissimilarity threshold.
N_max : Maximum allowed candidates.
λ: Weight balancing accuracy and diversity (0.3).
The final score for a submission is the average of P's across all samples. More information on the scoring is available in the Starter Notebook.
For the Final Evaluation, the top submissions on the Predictive Leaderboard will be invited to submit their fully reproducible Python code for review by a panel of judges. Because efficiency is key to this challenge, any solutions that use a brute-force grid search and static machine learning that does not use the simulation engine at inference will not be eligible for final submissions. If you are selected for final submissions and your solution uses a brute-force grid search, or static machine learning it will be immediately disqualified. We know you have some clever solutions to this problem and we want to see them! To encourage you to find efficient solutions, each final submission must run on a similar number of samples as the test dataset in under 1 hour on a G4dn.2xlarge machine on AWS.
Final Evaluation
Procedure for Finalists:
Finalists will be granted access to a remote Linux workspace environment via email invite.
Finalists will have a defined period of 5 days to transfer their models and code, install dependencies, and ensure that their solution is running correctly within this environment.
After the 5-day preparation period, participants will be locked out of the workspace.
The ThinkOnward Challenges team will then run the final models on a series of unseen holdout data.
The score achieved on the holdout data using the predictive leaderboard scoring metric will determine 70% of your final score.
Additionally, 20% of the final score will assess innovation and how you approached the problem. We want to see your clever solutions! These could include things like:
Active use of the simulator in parameter estimation (not just for training data generation).
Smart optimization strategies that go beyond brute-force (e.g., Bayesian optimization, reinforcement learning, surrogate modeling).
Evidence of learning at inference or adaptive refinement.
Generalizable methods that could apply to other simulation-driven problems.
We know lots of competitions are all about taking tried and true algorithms, models, and architectures, and squeezing out marginal performance gains to top the leaderboard, but this is not one of those!
Lastly, 10% of the final score will assess submissions based on the interpretability of their submitted Jupyter Notebook.
A successful final submission must contain the following:
Jupyter Notebook: Your notebook will be written in Python and clearly outline the steps in your pipeline
Requirements.txt file: This file will provide all required packages needed to run the training and inference for your submission. We recommend uv for package management (link)
Supplemental data or code: Include any additional data, scripts, or code that are necessary to accurately reproduce your results
Model Checkpoints (If applicable): Include model checkpoints created during training so we can run your model
Software License: An open-source license to accompany your code
Your submission must contain the libraries and their versions and the Python version (>=3.10). See the Starter Notebook on the Data Tab for an example.
Timelines and Prizes
Challenge will open on 10 December 2025 and close at 23:00 UTC 4 February 2026. Winners will be announced on 19 February 2026.
The main prize pool will have prizes awarded for the first ($10,000), second ($6,000), and third ($3,500) in the final evaluation. There will be one $500 honorable mention for valid submissions that contain innovative solutions to the problem as decided by the panel of judges.